Featured image of post Monitoring ZFS and Docker with TIG

Monitoring ZFS and Docker with TIG

Long term monitoring with Telegraf, InfluxDB, and Grafana for Docker, ZFS, and System Performance. This will go into graph reporting and metrics.

Introduction

I just want to start off by saying, this is the first TIG stack deployment I have ever done, and was a lot easier then I expected (at least for this use case). I also have another use case of wanting to monitor logs to determine how often issues are appearing, and that use case could be a bit more challenging, however I have not done a lot of research into it.

I have a homemade NAS system at home, that incorporates ESXi, Ubuntu, ZFS, and Docker for applications/services I want to run. One of the biggest issues I have is monitoring long term performance on the device. Because I am not running VSphere and am solely running ESXi, it makes it difficult to grab metrics from the hypervisor, so I am left to grab metrics from the guest.

I wanted a way to have historical data from the system in case something went horribly (not really, but maybe) wrong for troubleshooting purposes, being sent to another server.

A bit of background on the system in place here, and yes - I am a data hoarder and a fan of data storage systems.

TIG System Specs:

  • CPU: Intel NUC 8i3BEH1
  • Memory: 16GB RAM
  • Storage: 1x 128 GB NVME

ESXi Hypervisor Specs:

  • OS: ESXi 7.0
  • CPU: AMD Ryzen 7 1700 Eight-Core Processor
  • Memory: 64 GB ECC Memory
  • Storage:
    • NVME: 1x Samsung 970 Pro 1TB, 1x WD SN750 1TB
    • SSD: 2x Intel DC S3510 120 GB
    • SATA: 6x WD Red 6TB Drives
  • GPU: Nvidia GT 710
  • Motherboard: ASRock X470 Master SLI/AC
  • HBA: LSI 2008 PCI-E Card

NAS Guest Specs:

  • OS: Ubuntu 20.04 LTS
  • Memory: 48 GB
  • Root Drive: 40 GB
  • Passthrough:
    • HBA: LSI SAS2008 PCI-Express Fusion-MPT SAS-2 Falcon rev. 03 (Flashed to IT mode)
    • ZFS Pool: 32 TB (WD RED 6TB Drives - SATA_WDC_WD60EFRX-68L_WD)
    • Cache: 1TB

You might think 48 GB of memory is overkill for a system that mainly deals with storage and a few applications. Unfortunately, not at the current moment - but I do agree, it is overkill. I also use rclone as an online storage system with Google Drive as a backend. Meaning this is my normal:

1
2
3
4
    nas:~$ free -mh
                total        used        free      shared  buff/cache   available
    Mem:           47Gi        31Gi       1.1Gi       9.0Mi        14Gi        15Gi
    Swap:         3.8Gi       3.0Gi       909Mi

There is definitely some room for improvement, don’t get me wrong, but at the moment. However, without any historical data to go off of and just looking at the above command fro time to time, it isn’t sufficient to fine tune it further and make optimizations.

So with all that said and done, the things I wanted to monitor came out to be:
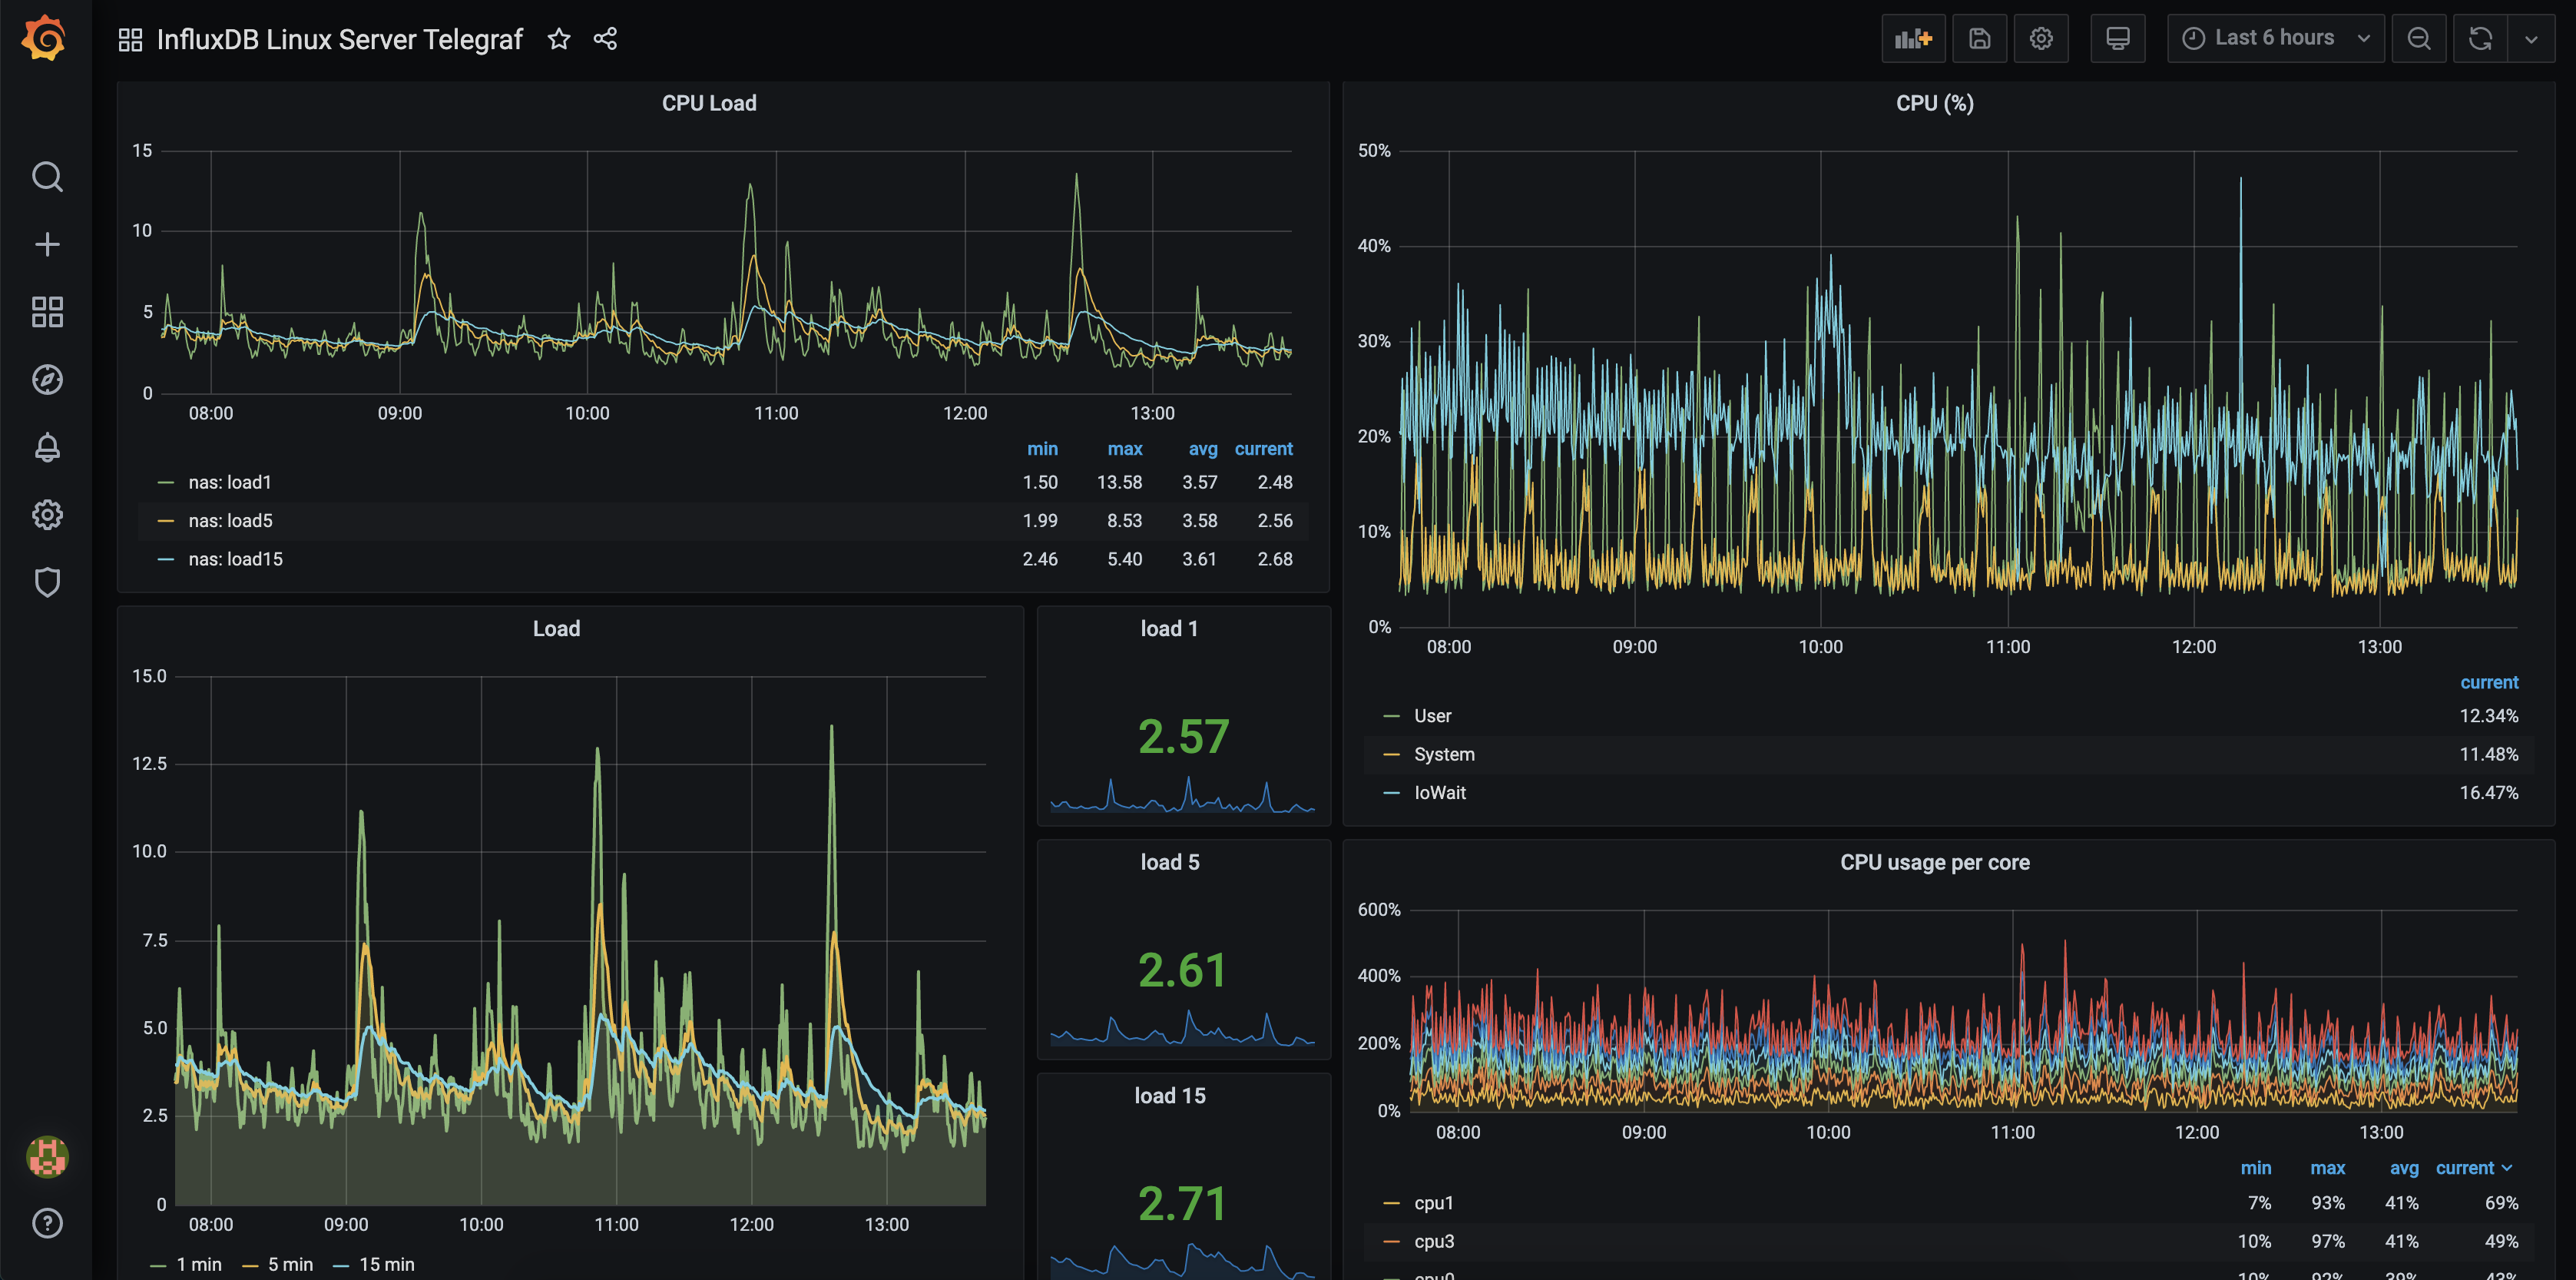
  • Memory Usage
  • CPU Usage
  • File System Usage
  • Docker
  • ZFS Pool
  • Network Traffic

Getting Started

Getting InfluxDB and Grafana running in Docker

Thankfully, Grafana and InfluxDB already provide decent out of the box docker images, so no modification is needed for a small scale deployment and what I am trying to accomplish.

I started out doing this for my docker-compose file

 1
 2
 3
 4
 5
 6
 7
 8
 9
10
11
12
13
14
15
16
17
18
19
20
21
22
23
24
25
26
27
28
29
30
31
32
33
34
35
36
    version: '3.3'
    services:
        grafana:
            ports:
                - '3000:3000'
            container_name: grafana
            environment:
                - 'GF_INSTALL_PLUGINS=grafana-clock-panel,grafana-simple-json-datasource'
            volumes:
                - '/media/docker/grafana/plugins:/var/lib/grafana/plugins'
                - '/media/docker/grafana/logs:/var/log/grafana'
                - '/media/docker/grafana/config:/etc/grafana/'
                - '/media/docker/grafana/data:/var/lib/grafana'
            restart: always
            image: grafana/grafana
            networks:
                - lame
        influxdb:
            container_name: influxdb
            ports:
                - '8086:8086'
                - '2003:2003'
            environment:
                - INFLUXDB_HTTP_AUTH_ENABLED=true
                - INFLUXDB_ADMIN_USER=$myuser
                - INFLUXDB_ADMIN_PASSWORD=$mysecret
            volumes:
                - '/media/docker/influxdb:/var/lib/influxdb'
            restart: always
            image: influxdb
            networks:
                - lame
    networks:
        lame:
            name: lame
            driver: bridge

I am aware Docker volume stores are supposedly the more supported/official way to go, due to their flexibility and ease of use, and honestly I do agree with that for larger scale systems. For my use case, it’s just more convenient to me to use bind mounts at the current moment.

You might notice I don’t have a web front end (something like Nginx, Traefik) in use here. I am hosting this for internal use only and it is not publicly available. Any public facing service goes through a different endpoint entirely (an nginx entrypoint). If I was setting up TIG publicly, I would consider using Traefik and enable docker swarm for ease of use. This is something I might do in the future, as I would love to implement Google’s oAuth service into Grafana, and at that point, I would feel more comfortable putting the service publicly on the internet for me to auth into.

Anyways, getting back on track.

Configuring Telegraf

Setting up telegraf is super easy, install the application, uncomment out the lines you want to monitor, and potentially add other information to.

On your system that you want to monitor (in my case, the NAS), edit /etc/telegraf/telegraf.conf with your favorite editor. An example of my configuration file is below.

  1
  2
  3
  4
  5
  6
  7
  8
  9
 10
 11
 12
 13
 14
 15
 16
 17
 18
 19
 20
 21
 22
 23
 24
 25
 26
 27
 28
 29
 30
 31
 32
 33
 34
 35
 36
 37
 38
 39
 40
 41
 42
 43
 44
 45
 46
 47
 48
 49
 50
 51
 52
 53
 54
 55
 56
 57
 58
 59
 60
 61
 62
 63
 64
 65
 66
 67
 68
 69
 70
 71
 72
 73
 74
 75
 76
 77
 78
 79
 80
 81
 82
 83
 84
 85
 86
 87
 88
 89
 90
 91
 92
 93
 94
 95
 96
 97
 98
 99
100
101
102
103
104
105
106
107
108
109
110
111
112
113
114
115
116
117
118
119
120
121
122
123
124
125
126
127
128
129
130
131
132
133
134
135
136
137
138
139
140
141
142
143
144
145
146
147
148
149
150
151
152
153
154
155
156
157
158
159
160
    cat /etc/telegraf/telegraf.conf | grep -v "#"
    [global_tags]
    user = "$USER"
    device = "nas"

    [agent]
    interval = "5s"
    round_interval = true
    metric_batch_size = 1000
    metric_buffer_limit = 10000
    collection_jitter = "0s"
    flush_interval = "10s"
    flush_jitter = "0s"
    precision = "ms"
    hostname = "nas"
    omit_hostname = false

    [[outputs.influxdb]]
    urls = ["http://$TIGSERVER:8086"]
    database = "nas"
    username = "$muyser"
    password = "$mysecret"

    [[outputs.health]]
    service_address = "http://:20202"
    read_timeout = "5s"
    write_timeout = "5s"
    basic_username = "teegraf"
    basic_password = "P4ssw0rd!"

    [[processors.date]]
        field_key = "month"
        date_format = "Jan"
        date_offset = "0s"
        timezone = "America/Los_Angeles"

    [[processors.enum]]
        [[processors.enum.mapping]]
        [processors.enum.mapping.value_mappings]

    [[processors.port_name]]
    tag = "port"
    dest = "service"


    [[processors.reverse_dns]]
    lookup_timeout = "3s"
    max_parallel_lookups = 10
    [[processors.reverse_dns.lookup]]


    [[inputs.cpu]]
    percpu = true
    totalcpu = true
    collect_cpu_time = false
    report_active = false

    [[inputs.disk]]
    ignore_fs = ["tmpfs", "devtmpfs", "devfs", "iso9660", "overlay", "aufs", "squashfs"]

    [[inputs.diskio]]
    device_tags = ["ID_FS_TYPE", "ID_FS_USAGE"]
    name_templates = ["$ID_FS_LABEL","$DM_VG_NAME/$DM_LV_NAME"]

    [[inputs.kernel]]

    [[inputs.mem]]

    [[inputs.processes]]

    [[inputs.swap]]

    [[inputs.system]]

    [[inputs.cgroup]]
        paths = [
        "/cgroup/memory",
        "/cgroup/memory/child1",
        "/cgroup/memory/child2/*",
        ]
        files = ["memory.*usage*", "memory.limit_in_bytes"]

    [[inputs.dns_query]]
        servers = ["192.168.2.2", "1.1.1.1", "8.8.8.8"]
        domains = ["google.com"]

    [[inputs.docker]]
    endpoint = "unix:///var/run/docker.sock"
    gather_services = false
    container_names = []
    source_tag = false
    container_name_include = []
    container_state_include = []
    perdevice = true
    total = false

    [[inputs.ethtool]]
    interface_include = ["eth0", "ens160"]
    interface_exclude = ["eth1"]

    [[inputs.internal]]
    collect_memstats = true

    [[inputs.kernel_vmstat]]

    [[inputs.linux_sysctl_fs]]

    [[inputs.net]]
        interfaces = ["eth0", "ens160"]

    [[inputs.netstat]]

    [[inputs.ping]]
    urls = ["google.com", "192.168.2.1", "192.168.2.2", "andrewdoering.org" ]

    [[inputs.smart]]
    use_sudo = true
    attributes = true
    timeout = "30s"

    [[inputs.sysstat]]
        sadf_path = "/usr/bin/sadf"
        activities = ["DISK", "INT", "ALL", "XALL", "XDISK"]
    [inputs.sysstat.options]
        -C = "cpu"
        -B = "paging"
        -b = "io"
        -q = "queue"
        "-r ALL" = "mem_util"
        "-u ALL" = "cpu_util"
        -v = "inode"
        -W = "swap"
        -w = "task"
        [[inputs.sysstat.device_tags.sda]]
        vg = "rootvg"

    [[inputs.systemd_units]]
    timeout = "1s"
    unittype = "service"

    [[inputs.temp]]

    [[inputs.zfs]]
    kstatPath = "/proc/spl/kstat/zfs"
    kstatMetrics = ["abdstats", "arcstats", "dnodestats", "dbufcachestats",
        "dmu_tx", "fm", "vdev_mirror_stats", "zfetchstats", "zil"]
    poolMetrics = true

    [[inputs.docker_log]]
        endpoint = "unix:///var/run/docker.sock"

    [[inputs.processes]]

    [[inputs.interrupts]]

    [[inputs.ipvs]]

    [[inputs.procstat]]
    pattern = "httpd|java|python|telegraf|tomcat8|htop|apache2|www-data|rclone|docker"
    user = "daemon|root|telegraf|www-data|tomcat8|andrew"

I won’t lie, I might have gone a bit overboard on the configuration of monitoring details, especially for what my original intent was to log. However, this achieves what I want. With this, I get a pretty decent reporting tool. Some improvements above could be using variables in the configuration file, to allow for the file to be replicated or used without having to modify or specialize it to specific systems. This is something I am planning on doing as I write up my ansible repo.

Configuring InfluxDB

Considering this TIG is only monitoring a single host, I setup InfluxDB to have a longer retention time of the data, specifically two years worth of time. If it was monitoring several systems, I would probably lower this to 6 months for 5 devices, mainly just to be on the conservative side.

1
2
3
4
    auth
    create retention policy "2_year" on "nas" DURATION 104 replication 1
    alter retention policy "autogen" on "nas" duration 104w SHARD DURATION 104w DEFAULT
    show retention policies on nas

Once you have changed retention, and have telegraf running, double check that you have data feeding in correctly by checking one of the values, an example of that can be done by performing the following command:

 1
 2
 3
 4
 5
 6
 7
 8
 9
10
11
12
13
14
15
16
17
18
19
20
21
22
23
    > show tag values on nas from docker_container_status with key = container_name
    name: docker_container_status
    key            value
    ---            -----
    container_name apollo
    container_name athena
    container_name bazarr
    container_name bazarr-swedish
    container_name calibre
    container_name calibre-web
    container_name dionysus
    container_name jackett
    container_name lazylibrarian
    container_name lidarr
    container_name netdata
    container_name radarr
    container_name radarr-swedish
    container_name readarr
    container_name rutorrent
    container_name sonarr
    container_name sonarr-swedish
    container_name znc
    > 

From here, you should be able to start setting up graphs in Grafana.

Configuring Graphs in Grafana

Grafana hosts a lot of good template graphfs here, and admittedly, a lot of them for my use case don’t work (beacuse I was not using Docker Swarm, or the default template just didn’t align with my database). So it required a bit of rework in some cases to fix the Variables configurations.

Docker Dashboard

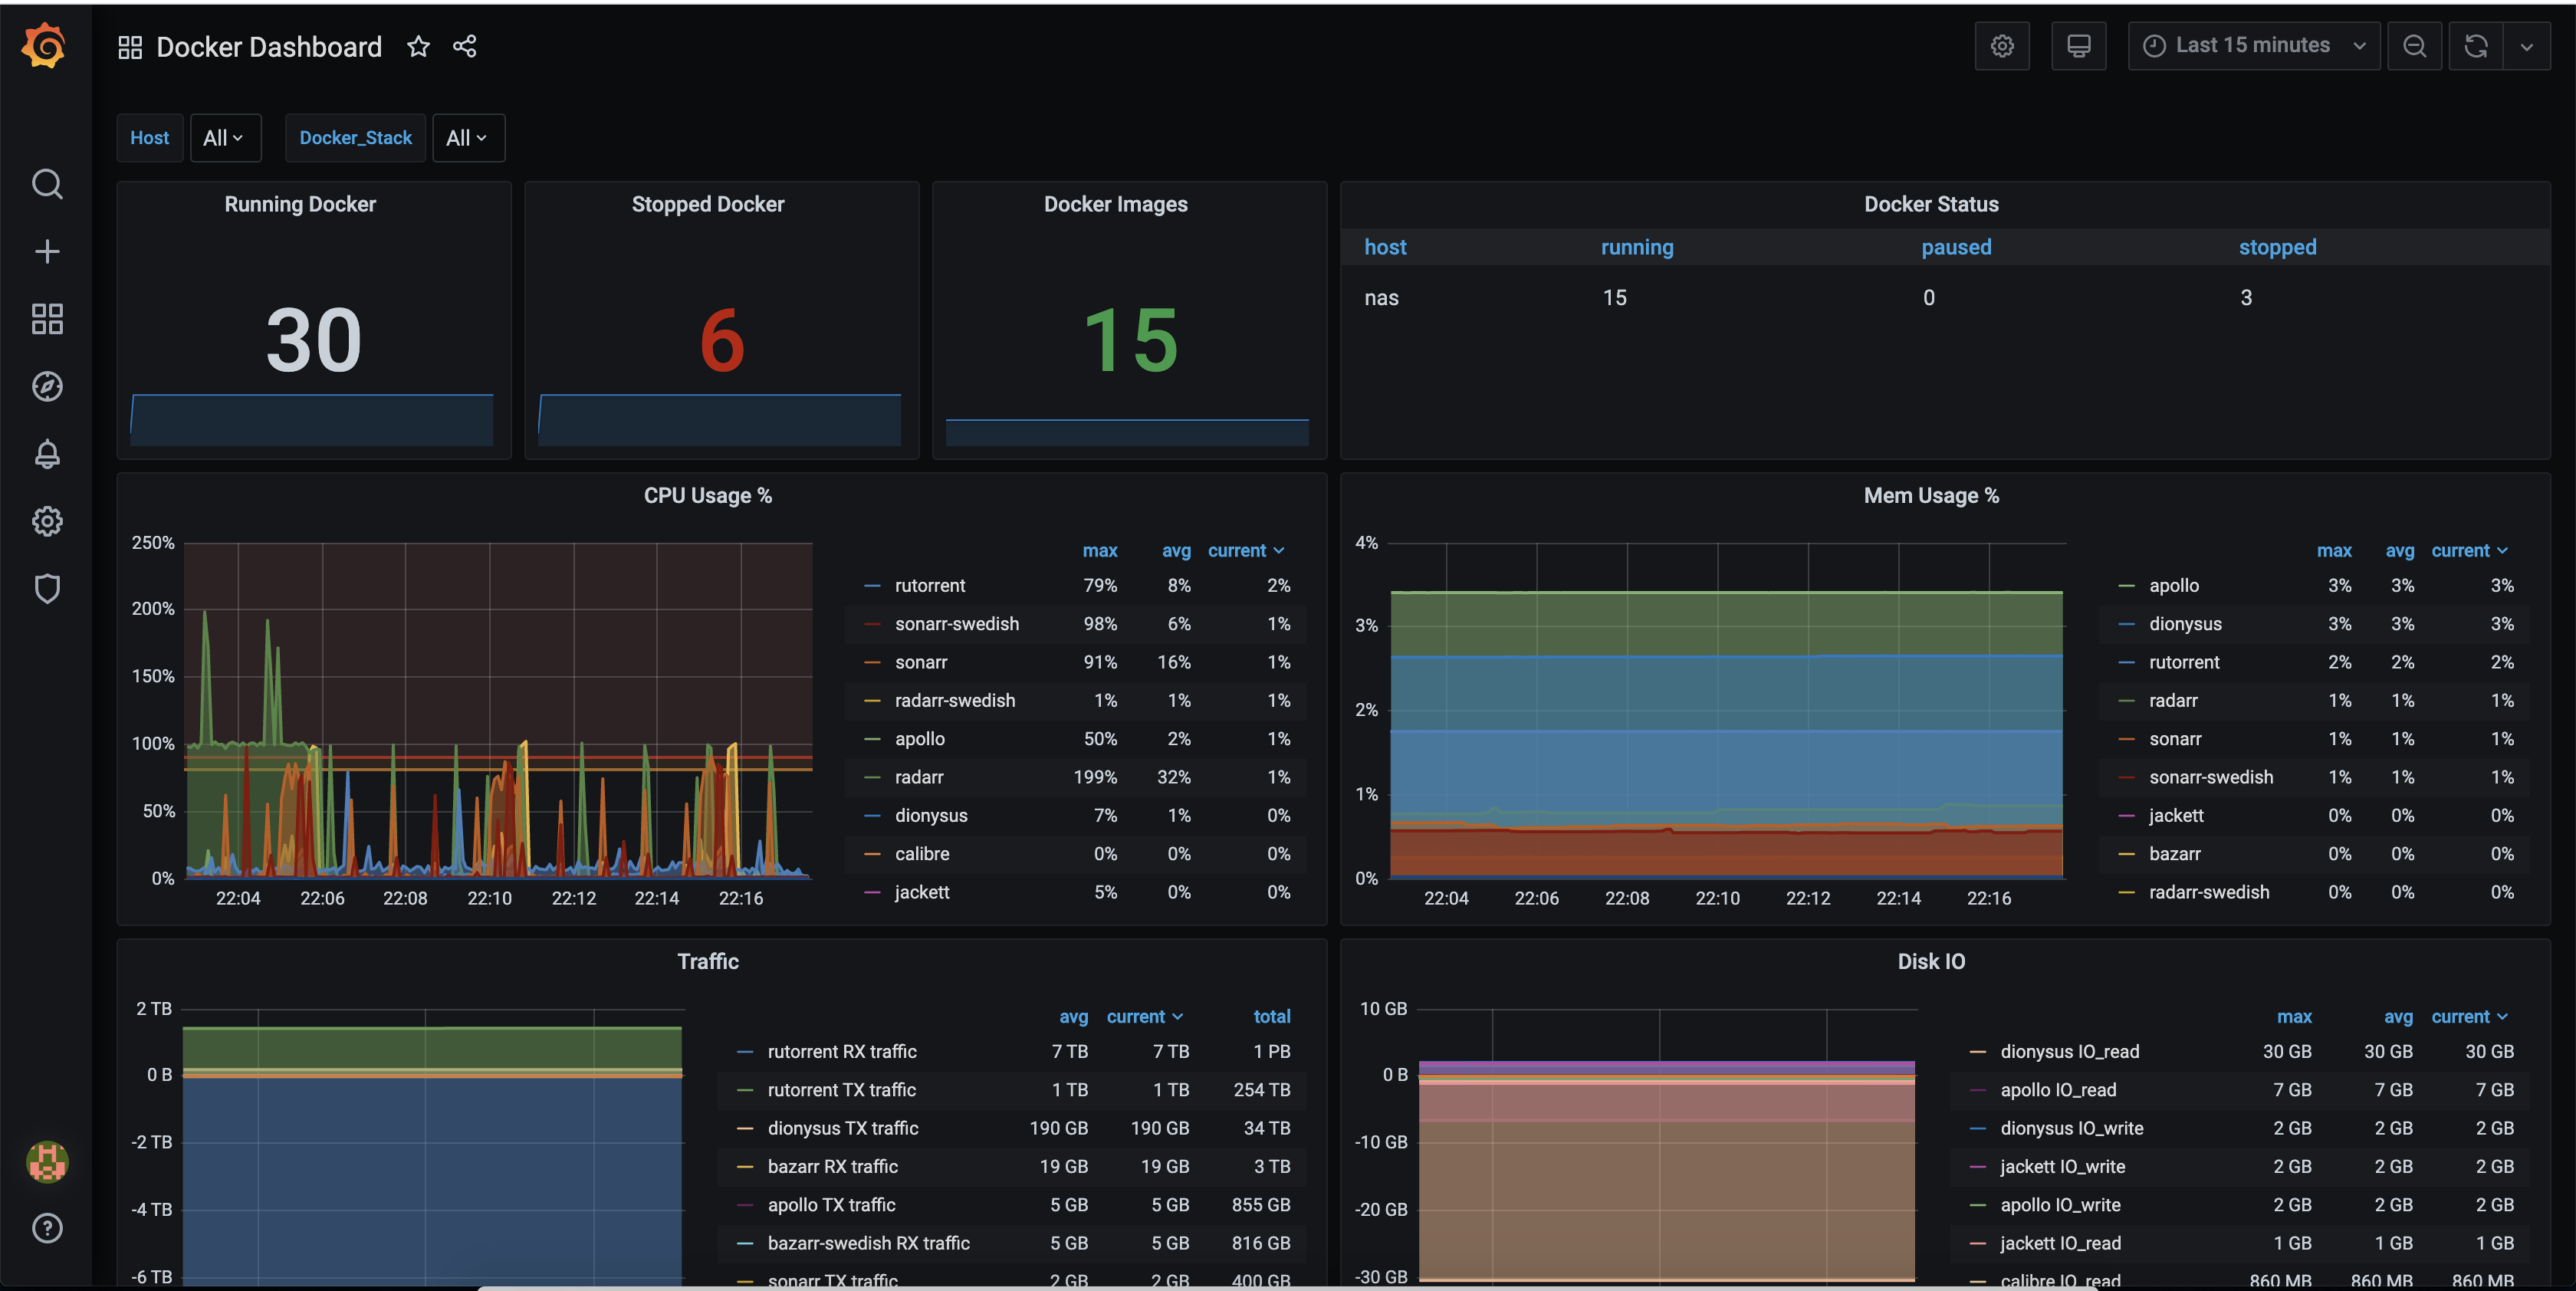
When it comes to System Performance, I came across another pre-made graph, that had the features I wanted, but, didn’t work instantly when loading via the dashboard id. After a bit of tweaking to data sources, and Variables, I eventually got it working well and now have a rotating dashboard.

System Dashboard

Future things I want to do

I really want to look into using Grafana Infinity to pull public data, and have some ideas on using some of the other public plugins. As I mentioned, I really want to pull in logs from different systems as datasources, namely rclone, nginx/traefik, pihole, and unifi to name a few.

I had done some research into scraping smart fans, and using temperature sensors as input data, but, living in a 400sqft apartment there is not a lot of variation, and unfortunately, I don’t have a lot of electrical outlets in my apartment. My entire bedroom has two.

However, this was a pretty good learning experience, and a good start going forward. Plenty of room to expand as I get more space and more time to utilize it.

I also reached out to some of my co-workers to see if they could tell me what the newest and best thing is, and have been hearing a lot about netdata.cloud, so that is also something I may look at moving to in the long term.

comments powered by Disqus
Thanks for stopping by!
Built with Hugo